Another tidbit from the report I'm writing about :

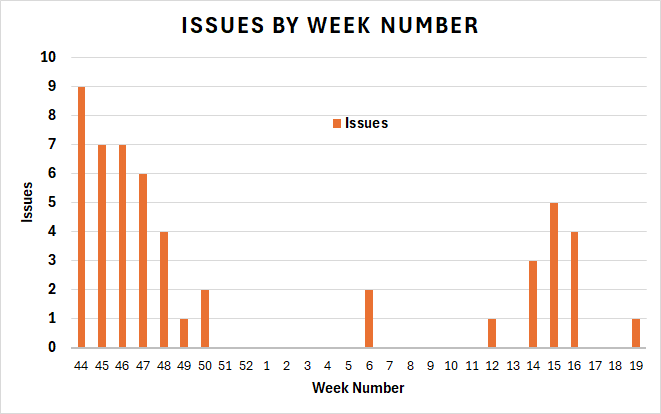
The 52 issues filled correspond roughly to 30% of all the crashes (issues with "type-crash" label) and 2% of all issues (features requests, bugs and invalid issues) reported in the issue tracker during the six months period covered by the report.

Hits and new issues don't appear at a steady pace. It seems that there are long periods of no or nearly no new issues, followed by rapid finding of new results.

A bar graph of issues filed by week number, with X axis ranging from week 44 to week 19 and Y axis ranging from zero to 10 issues. The distribution looks bi-modal, with a clump of high numbers of issues per week from week 44 to 50, zero issues for weeks 51 to 11 (except by two issues in week 6), and a smaller clump of medium numbers of issues from week 12 to 16.
0

If you have a fediverse account, you can quote this note from your own instance. Search https://mastodon.social/users/danzin/statuses/114474756030319654 on your instance and quote it. (Note that quoting is not supported in Mastodon.)