I find it weird how many physical processes look like extremely unlikely events drawn from some probability distribution. Most of thermodynamics looks like this - the Boltzmann law is what you get if you assume particles have energies drawn from a wide flat probability distribution conditioned on the sums of energies being very low.
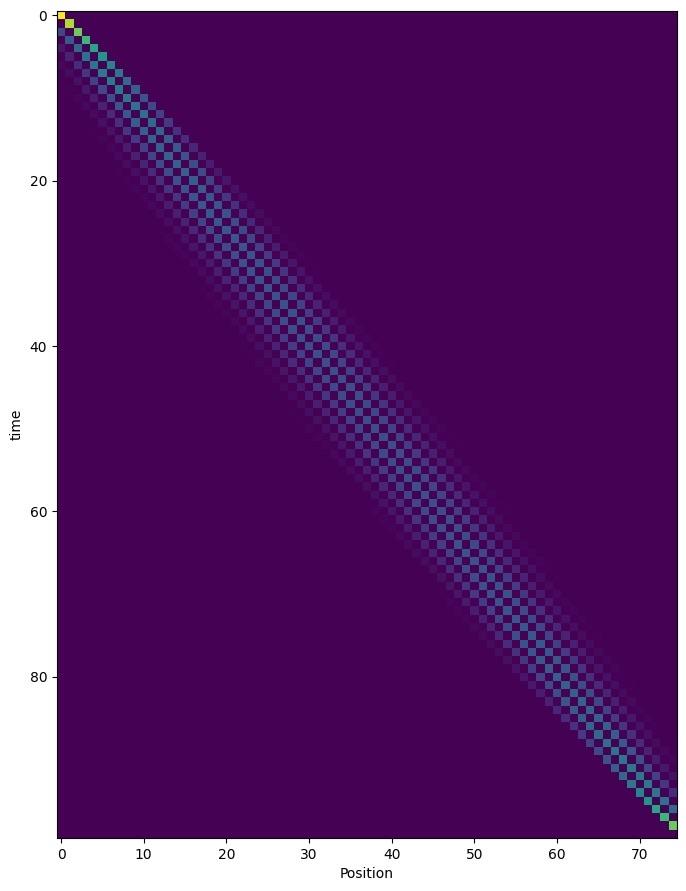
Suppose you have a particle doing a random walk on the integers with a 50/50 chance of going left or right at each step. After 100 steps it's very unlikely to have moved 75 steps to the right. Nonetheless, we can still ask about its likely trajectory conditioned on it ending up 75 steps to the right. The first plot is really a stack of 101 plots. Row T of pixels represents the conditional distribution at time T given that the particle walked from 0 at time 0 to 75 at time 100. As you might expect, we get a cloud that expands to maximum uncertainty at the midpoint - and of course the checkerboard pattern due to parity. The key thing is we get a cloud around a straight line...