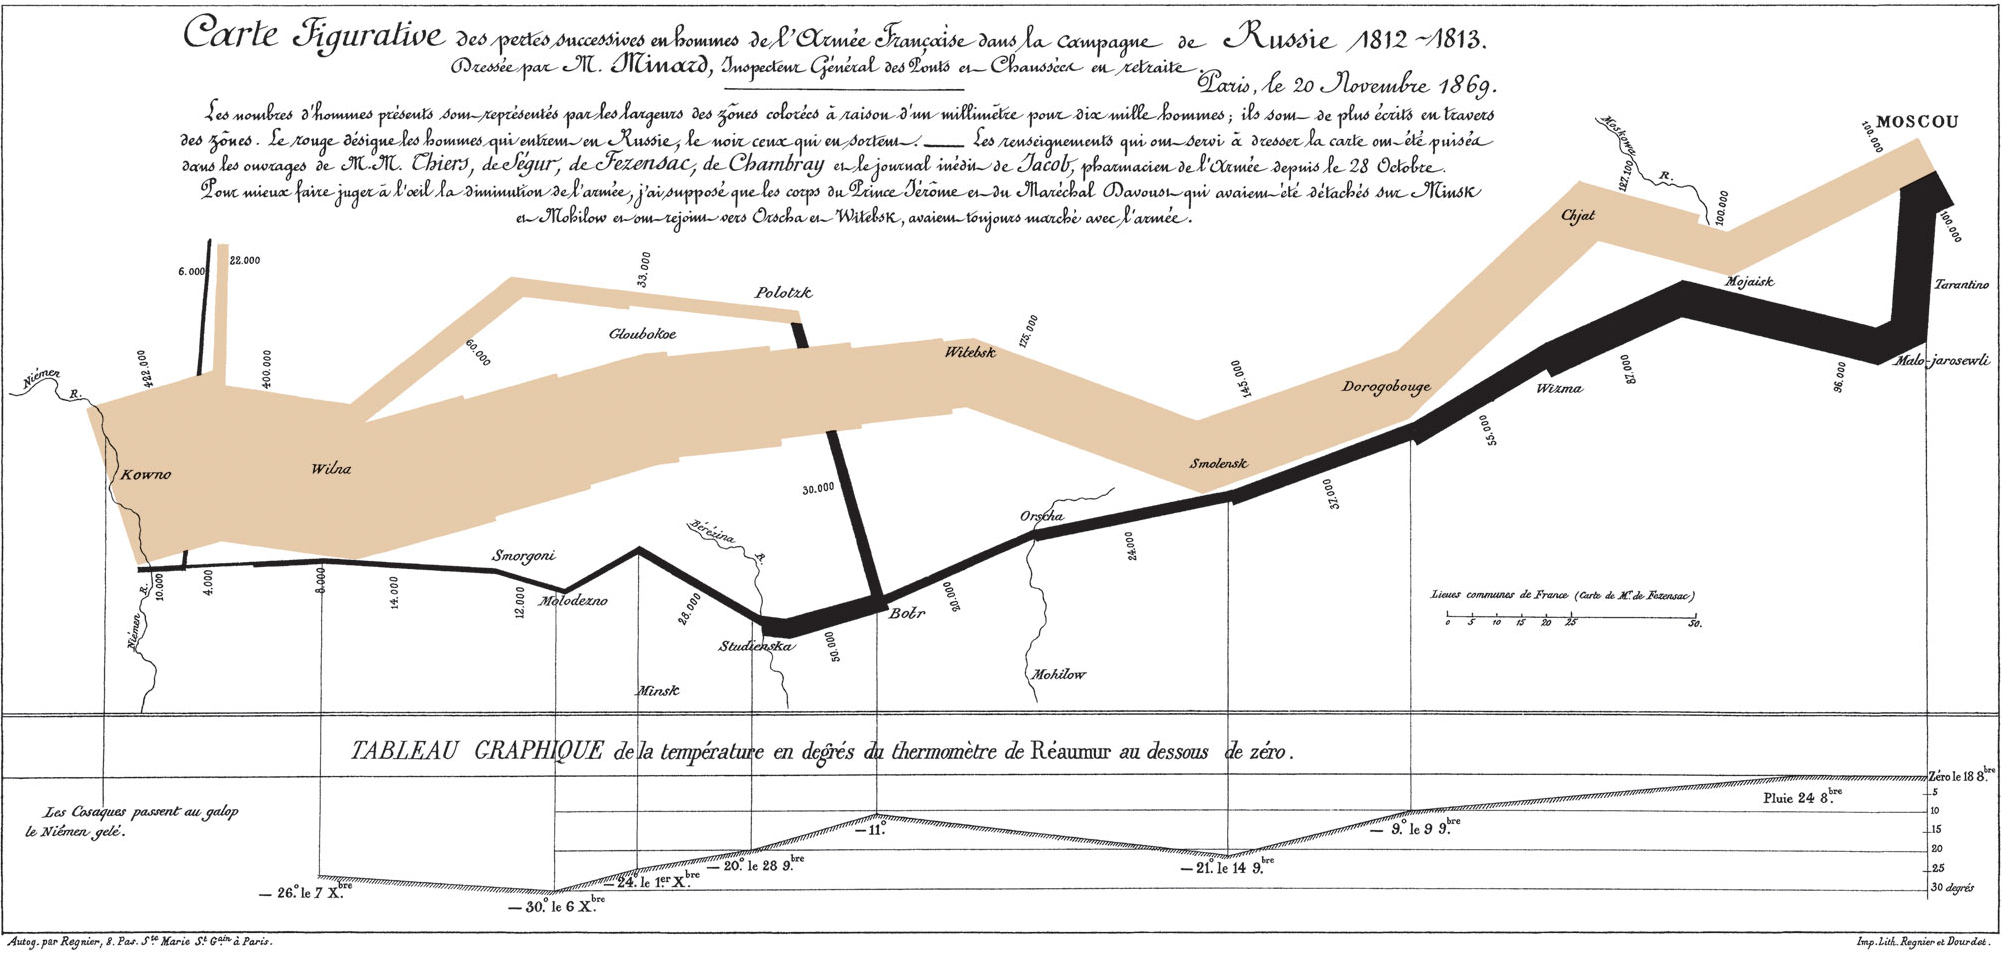
French civil engineer Charles Joseph Minard was born in 1781. He was known for his contributions to information graphics, including his famous map of the losses suffered by Napoleon during the 1812 Russian campaign.

Writing about Minard's map, Edward Tufte said “It may well be the best statistical graphic ever drawn.”

Image: Charles Minard / Public domain

Minard’s map famously encodes multiple streams of data describing Napoleon’s disastrous 1812 Russia campaign. A thick beige, which grows narrower from the left edge (Europe) to the right edge (Moscow) of the image, shows the number of troops making up Napoleon’s force. A black line that narrows from right to left across the page shows the same number on the return journey. A plot at the bottom shows temperature on the journey, and numerous other piece of information are inscribed on the map.
0
0
0

If you have a fediverse account, you can quote this note from your own instance. Search https://mastodon.social/users/mcnees/statuses/114235136815286060 on your instance and quote it. (Note that quoting is not supported in Mastodon.)