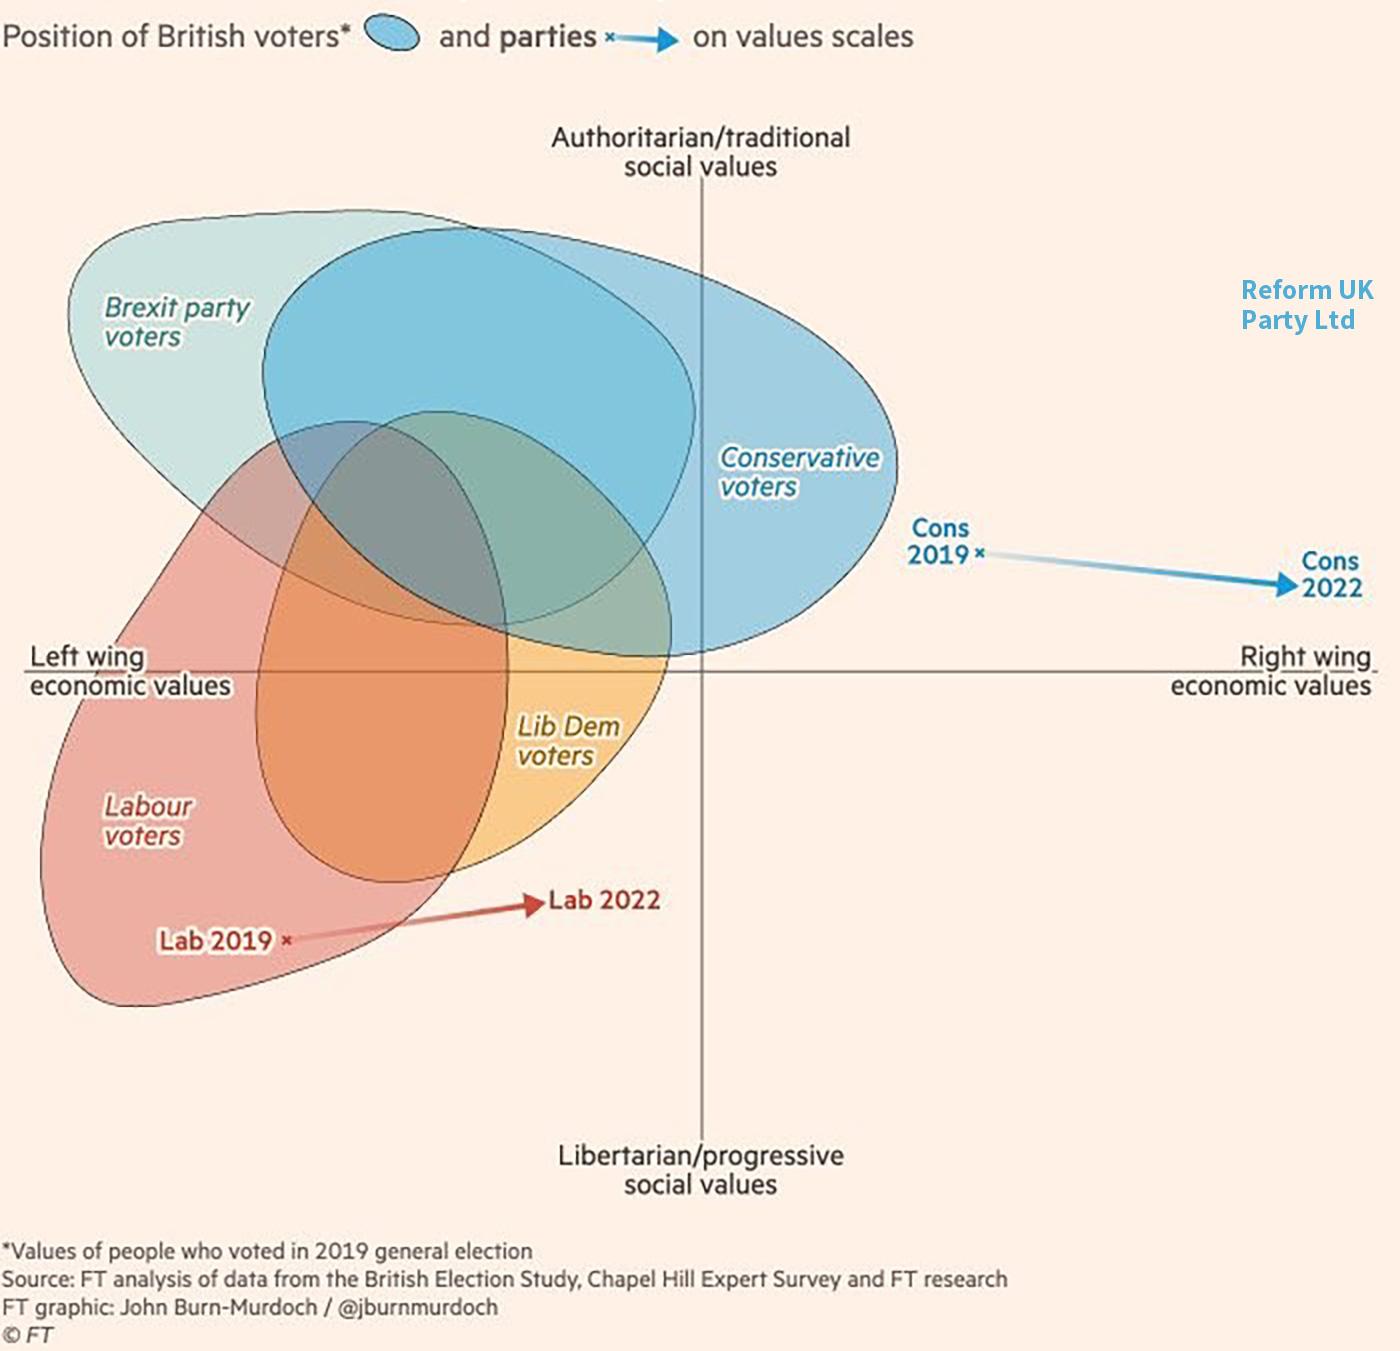
In September 2022, the FT published ft.com/content/d5f1d564-8c08-4 (no-paywall at archive.is/6P8FI).

It had a graphic that showed where voters for the Brexit, Conservatives, Liberal Democrats and Labour parties mapped themselves to be in 2019 as an outcome of research questions, on axes of economic and social values.

The focus was on the distance between where Conservative voters viewed themselves to be and where the party’s MPs were. I’ve overlayed where Reform UK representatives probably are

A political mapping of 4 quadrants, illustrating how voters self-identified in 2019, along axes of left to right wing economic values (horizontally) and libertarian/progressive to authoritarian/traditional social values (vertically). Labour voters placed themselves firmly to the left of centre with some above the centre point of social values. LibDems were further to the right but still left of centre. Conservative voters were firmly above the social centre and spread significantly either side of the economics centre. Brexit Party voters were solidly left of the economics centre but also at the upper end of authoritarian/traditional. 

The map also shows how distant MPs were from how their voters identify. In 2022, this was particularly acute with Conservative MPs and much less so for Labour. I’m suggesting with where I have placed the text “Reform UK Party Ltd”, that it’s even more acute for them, who seem to me to be thoroughly right wing in economics terms (what they say is different), and well towards the authoritarian end on social values.

The original mapping is credited to John Burn-Murdoch at the FT, with analysis of data from the British Election Study, Chapel Hill Expert Survey and FT research.
0

If you have a fediverse account, you can quote this note from your own instance. Search https://mastodon.social/users/urlyman/statuses/114437610906205685 on your instance and quote it. (Note that quoting is not supported in Mastodon.)