🚨🌍 NEW ARTICLE 🌍🚨
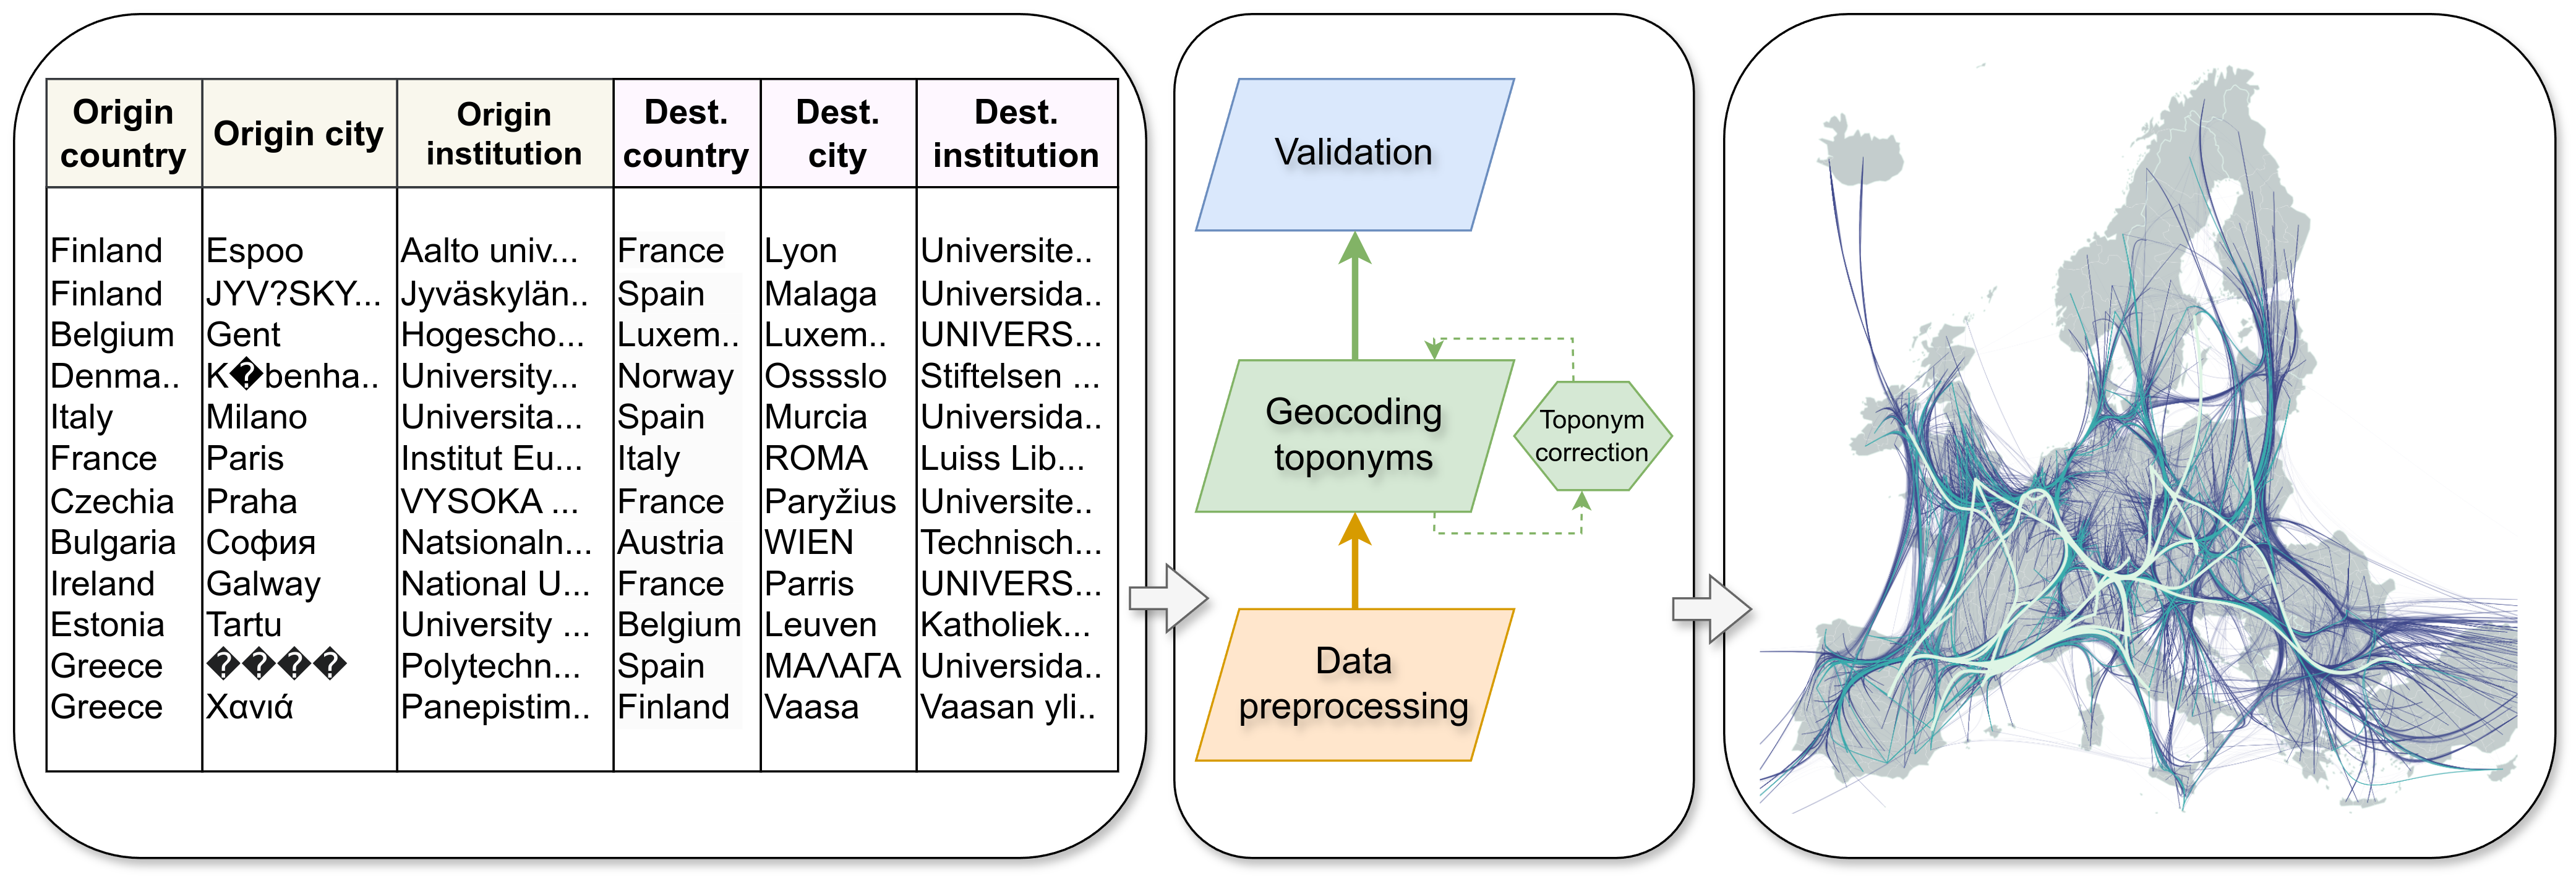
We geocoded the #mobility of over 2 million #Erasmus students across #Europe from 2014 to 2022 with ![]() @miladmzdhMilad Malekzadeh Oula Inkeröinen & Olle Järv. The data descriptor article is published in #ScientificData, and is an output from the #MobiTwin project.
@miladmzdhMilad Malekzadeh Oula Inkeröinen & Olle Järv. The data descriptor article is published in #ScientificData, and is an output from the #MobiTwin project.
https://doi.org/10.1038/s41597-025-04789-0
![]() @digigeolabDigital Geography Lab
@digigeolabDigital Geography Lab
#GIScience #Geospatial #GIS #MobiTwin #OpenData #OpenScience