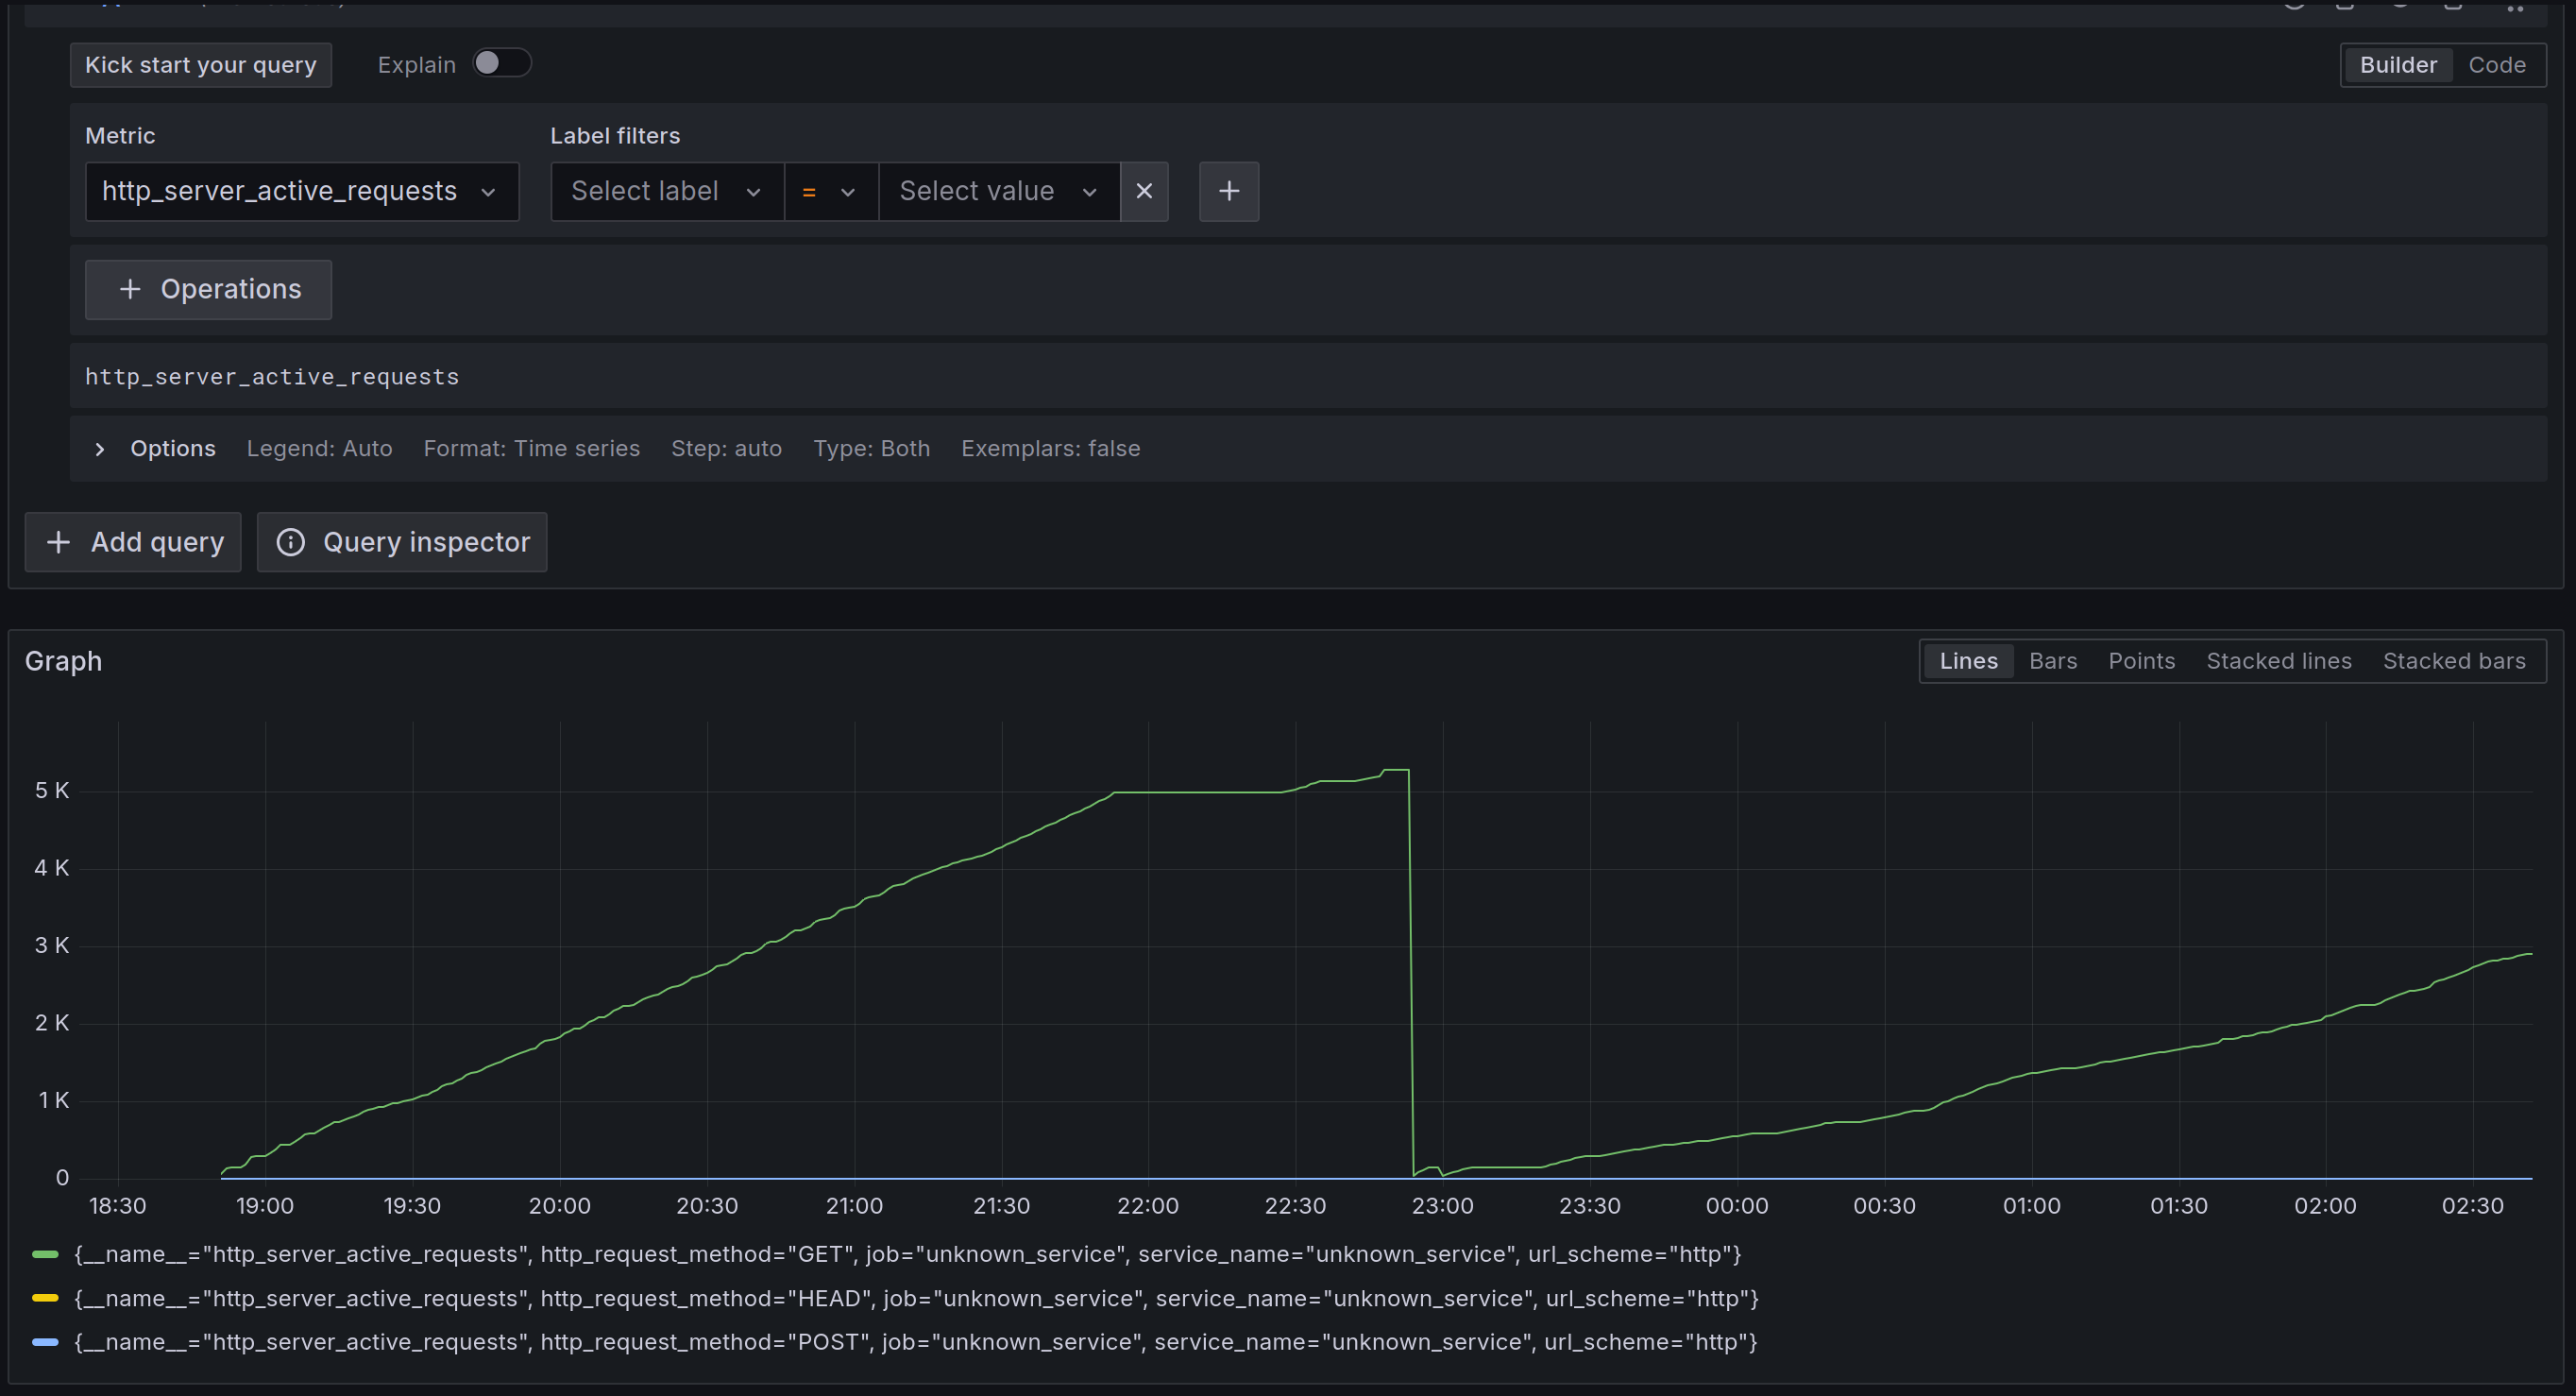
Okay, so either Deno's OpenTelemetry metric “http.server.active_requests” (https://docs.deno.com/runtime/fundamentals/open_telemetry/#http.server.active_requests) is actually cumulative over the lifetime of the process, or I have found the explanation for why I can't get the Encyclia server to behave.
Next question is what I could be doing wrong. 🤔 All it does is “deno run” and everything that doesn't time out seems to return what it should.
(The middle of the graph is where I restarted Deno twice.)