Okay, so either Deno's OpenTelemetry metric “http.server.active_requests” (docs.deno.com/runtime/fundamen) is actually cumulative over the lifetime of the process, or I have found the explanation for why I can't get the Encyclia server to behave.

Next question is what I could be doing wrong. 🤔 All it does is “deno run” and everything that doesn't time out seems to return what it should.

(The middle of the graph is where I restarted Deno twice.)
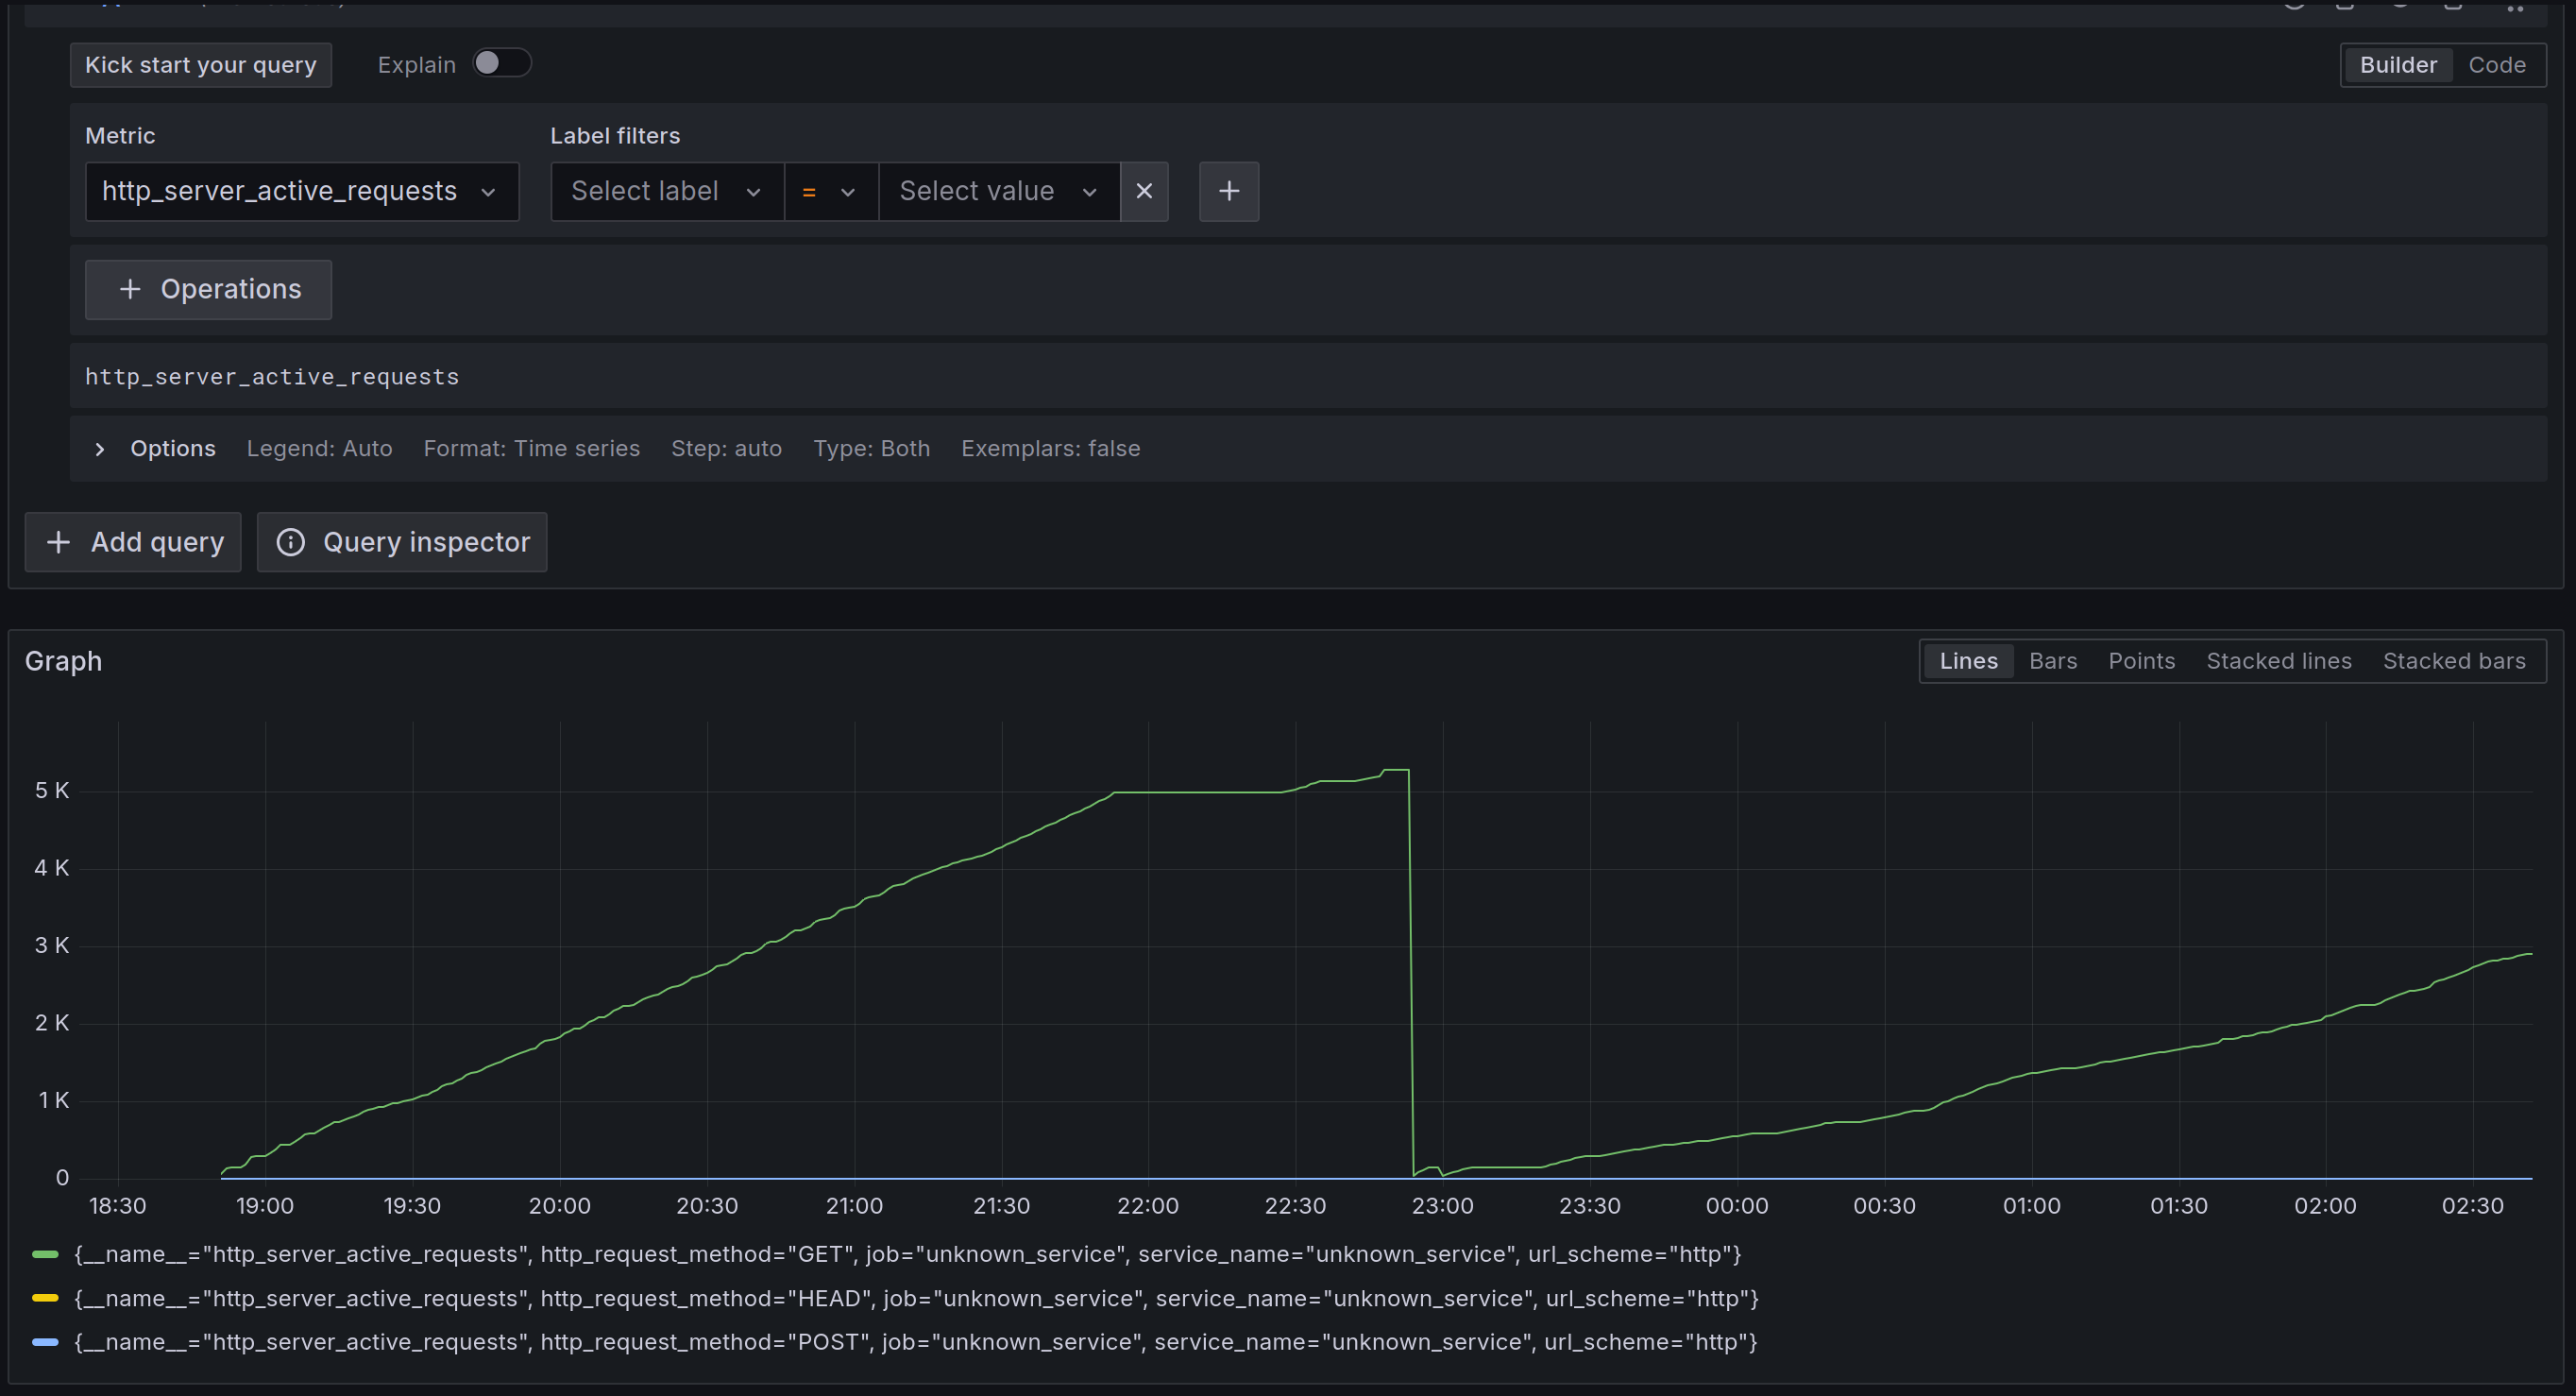
Line graph showing "http_server_active_requests" over a 9 hour duration. It starts at 0, climbs to 5000 almost in a slow straight line over 3 hours, then drops back down to 0, makes a tiny, quick bump up to 100 and back down to 0, only to start climbing again, slightly slower, to 3000 over the course of about 3.5 hours

Ah, found the culprit. It was one of the spots where I told the program to do nothing later. Turns out my wording was slightly off.

Before:

return new Promise(() => {});

After:

return Promise.resolve(null);

The number of concurrent connections looks negligible now, and no more timeouts either. Calling it a success for tonight, we'll see how things look in the morning. 🥱

As underwhelming as the cause is, that journey might deserve a blog post if I find the time!

0

If you have a fediverse account, you can quote this note from your own instance. Search https://fietkau.social/users/julian/statuses/115403919822882930 on your instance and quote it. (Note that quoting is not supported in Mastodon.)